Click-through fell on three sites. It meant three different things.
Comparing like with like after Google's September 2025 change, one site's click-through fell because it was seen for far more searches, one's partly because its own brand searches lost clicks, probably to the business's app, and one's because the same searches got fewer clicks at the same position.
Click-through rate is the share of people who see your listing in Google and then click it. When it falls, it looks as if people have stopped choosing you. Of the five accounts I checked, it fell on four over the same seven weeks. Here are three of them. The cause looked different each time, and only one showed the same searches getting fewer clicks at the same position.
First, compare like with like
Around 10 to 14 September 2025, Google stopped serving 100 results on one page. This is widely put down to rank-tracking tools, which loaded those long pages and so added impressions in Search Console for any site listed on them, however far down. Whatever the cause, impressions in Search Console dropped sharply and stayed down.
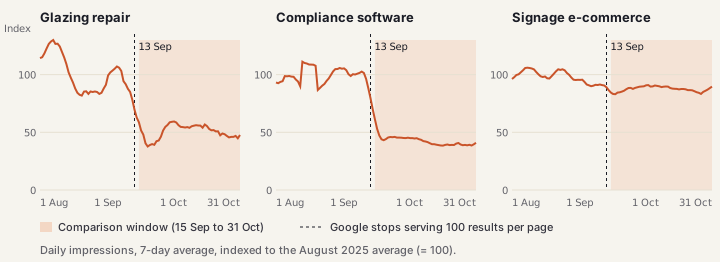
Source: Google Search Console, web search, 1 August to 31 October 2025.
Months before the change show inflated impressions, a worse-looking average position and a lower click-through rate, so they cannot be compared with later months. Every comparison here uses 15 September to 31 October, in 2025 and 2026. Matching dates also rule out the normal seasonal pattern.
The main test compares the same search in both years while it sat in the same position band: 1 to 3, 4 to 10, 11 to 20, or 21 and below. If click-through holds there but falls overall, the fall is dilution: new, lower-ranked searches pulling the average down. If it falls within a band, people are clicking less at the same position.
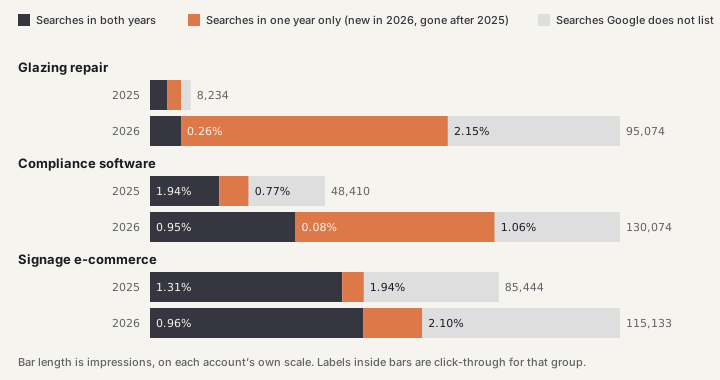
Source: Google Search Console, web search, 15 September to 31 October, 2025 and 2026. "Not listed" is the property total minus listed searches.
Glazing repair: seen for far more searches
Click-through fell from 1.63% to 1.04%. Clicks went from 134 to 992 and impressions from 8,234 to 95,074.
Most of the extra impressions came from searches not listed for the site a year earlier. Those had 53,978 impressions, three quarters of them at position 21 or lower, and were clicked 0.26% of the time. Most were product searches, such as glass types and unit sizes, at 0.34%. Showing up for thousands of new searches, mostly well down the results, pulls the average down even if nothing else changes.
What I cannot show is whether the non-brand searches it already had held up. They earned three clicks in each year, too few to compare. Click-through on searches for the business by name rose from 27.3% to 32.8%. The searches Google lists account for only 24% of this account’s 2026 clicks.
Compliance software: dilution, and brand clicks moving
Click-through fell from 1.11% to 0.61%. Clicks went from 536 to 795 and impressions from 48,410 to 130,074.
Three quarters of the extra impressions came from non-brand searches. Its core category terms moved from pages six to nine of Google to page two, and other non-brand searches reached lower page one, but these were rarely clicked: non-brand impressions rose from 21,894 to 82,413 while clicks went from 26 to 63. Searches for other companies with similar names added about 6,000 more impressions.
The account’s own brand searches also lost clicks, and the UK figures show where.
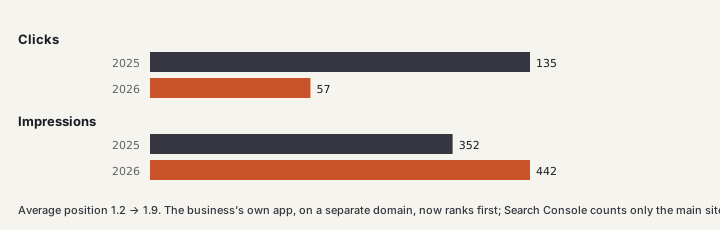
Source: Google Search Console, web search, UK, 15 September to 31 October, 2025 and 2026.
The business’s app, on a separate domain, now ranks first for that search, and Search Console counts only the main site. Those clicks probably went to the app rather than being lost, but this data cannot show how many. Overall, UK clicks fell from 272 to 233, and all of the account’s click growth came from outside the UK.
Signage e-commerce: a real loss at the same position
Click-through fell from 1.49% to 1.36%. Here, the searches the site already had lost clicks within the same position band.
Table 1. Signage e-commerce: the same searches, in the same position band, in both years.
| Position band | Searches | 2025 | 2026 | Average position, 2025 → 2026 |
|---|---|---|---|---|
| 1 to 3 | 60 | 2.84% | 2.11% | 2.5 → 3.3 |
| 4 to 10 | 291 | 0.85% | 0.69% | 6.6 → 6.8 |
Source: Google Search Console, web search, 15 September to 31 October, 2025 and 2026. All searches, brand included.
Positions 4 to 10 are the cleaner test, because average position barely moved there. In the top three it slipped from 2.5 to 3.3, which could explain part of that fall. The 4 to 10 fall holds for UK searches only, on desktop and on mobile. The searches Google lists cover only 35% of this account’s 2026 clicks, so I checked pages too, which cover nearly all of them: the 106 pages that stayed in positions 4 to 10 went from 1.31% to 1.02%. Most of the lost clicks are on product searches.
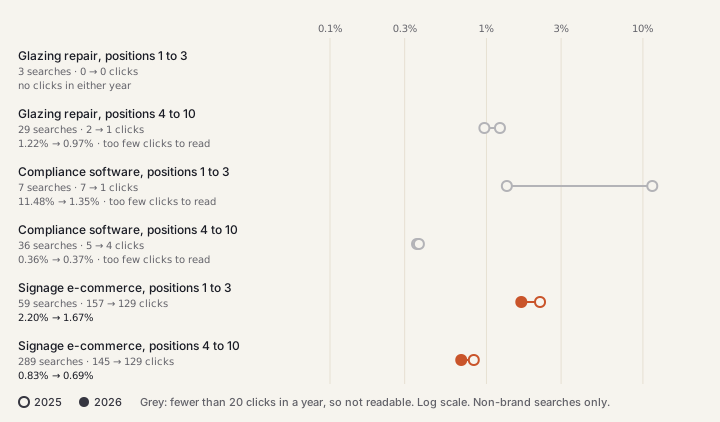
Source: Google Search Console, web search, 15 September to 31 October, 2025 and 2026. Grey rows have fewer than 20 clicks in a year.
I do not know why signage lost clicks. On 7 November 2026, checked through DataForSEO on desktop in the UK and signed out, product carousels appeared on 77% of the 415 searches that held their position band from July to October, and AI Overviews on 90%.

Source: DataForSEO live results, 7 November 2026; click-through from Google Search Console, July to October 2026.
The carousels were also already there before the 2026 period. Of the 19 largest of those searches with saved snapshots, 16 showed carousels by November or December 2025, so they probably do not explain a fall measured against September and October 2025. AI Overviews barely appear in those snapshots until mid-2026, but the snapshots may not capture them the way a live check does, so I cannot say when they arrived.
Some of those visitors may have arrived another way. This is the one account here whose tracking did not change during 2026, and its analytics look steady enough to compare: visits from Google search ran at 56% to 73% of Search Console clicks each month from July 2025, lowest in May and October 2026. Over the same weeks, visits from AI tools such as ChatGPT and Perplexity rose from 8 to 35, and from Bing from 5 to 43. AI tools brought 8 orders, against none a year earlier. That is real but small. The searches the site already had lost about 116 Google clicks, so other sources make up at most about half of that, and only if every one of those visits replaced a Google click.
What about the season?
Comparing the same dates a year apart removes the normal seasonal pattern, but not a season that shifted, such as a peak that came earlier one year. Ruling that out needs several years of matching dates. Search Console keeps 16 months, and the months before mid-September 2025 are distorted by Google’s change, so I cannot test it.
What this cannot show
These are three accounts, and seven weeks is a short comparison. Average positions are averages across many searches, the brand terms are my own definitions, and the results-page checks show today, not 2025. Google also hides searches that very few people make, so the search-level figures cover between 24% and 70% of each account’s clicks, depending on the account and year. The figures also cover Google search only. Visits from AI tools, Bing or people typing the business’s name directly could have grown while Google clicks fell. Tracking changes during 2026 make that comparison unreliable for most of these accounts; signage, the exception, is covered above.
Run the check on your own site
- Compare matching dates a year apart, and start no earlier than 15 September 2025.
- Export the Queries table for both periods and keep the searches that appear in both.
- Group them by average position: 1 to 3, 4 to 10, 11 to 20, and 21 and below. Compare click-through within each group, and watch whether positions moved within a group.
- Separate searches for your own name, and for other businesses with similar names. Check whether another site you own, such as an app or a shop, now ranks for your name.
- If the searches Google lists cover only a small share of your clicks, repeat the comparison with the Pages table.
If click-through holds within each group, the fall is dilution. If it falls within a group, people are clicking you less at the same position. Then search those terms yourself, signed out, and see what now sits above your listing.
The evidence
Table 2. Every test, by account.
| Test | Glazing repair | Compliance software | Signage e-commerce |
|---|---|---|---|
| Click-through | 1.63% → 1.04% | 1.11% → 0.61% | 1.49% → 1.36% |
| Impressions | 8,234 → 95,074 | 48,410 → 130,074 | 85,444 → 115,133 |
| New searches in 2026 | 53,978 impressions at 0.26% | 55,118 impressions at 0.08% | 14,514 impressions at 0.28% |
| Same search, same band, top 3 | rose (brand searches) | fell, 20.0% → 15.6% (mostly brand) | fell, 2.84% → 2.11% (position slipped 2.5 → 3.3) |
| Same search, same band, positions 4 to 10 | too few clicks to read | non-brand flat, 0.36% → 0.37% | fell, 0.85% → 0.69% |
| Same page, same band, positions 4 to 10 | not testable (1 page in both years) | 6 pages, too few clicks to read | fell, 1.31% → 1.02% (106 pages) |
| UK only, desktop, mobile (top 3) | rose in each | fell in each (mostly brand) | fell in each |
| Share of 2026 clicks the listed searches cover | 24% | 54% | 35% |
| Verdict | dilution | dilution, plus brand clicks lost, probably to its own app (not measurable here) | fewer clicks at the same position, cause not established |
Source: Google Search Console, web search, 15 September to 31 October, 2025 and 2026, unless stated. Brand searches are defined by business name; searches for other companies with similar names are excluded from compliance's non-brand figures.
References
- Google Search Console Help, How impressions, clicks and position are counted, including AI Overviews.
- Search Engine Land, Why Google Search Console impressions dropped, on the September 2025 change.
- DataForSEO, Google organic results API, used for the live results-page checks.
- DataForSEO, Historical SERPs, used for the carousel timing.
- PYC, The compounding curve: a field study, twenty months of these accounts' Search Console data.